Introduction
Example 1 - Ethanol CH3CH2OH
 {width ="300"}
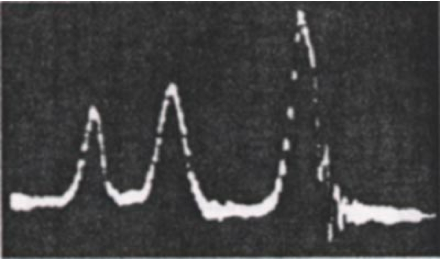
The discovery that one could actually see chemical shifts in hydrogen spectra was made in 1951 at Stanford University by Packard, Arnold, Dharmatti (shown in Fig 1). We will try to reproduce this result.
FILES:
- ethanol.cell
%BLOCK LATTICE_ABC
6 6 6
90 90 90
%ENDBLOCK LATTICE_ABC

%BLOCK POSITIONS_ABS
H 3.980599 4.178342 3.295079
H 5.033394 3.43043 4.504759
H 5.71907 4.552257 3.315353
H 3.720235 5.329505 5.509909
H 4.412171 6.433572 4.317001
H 5.911611 5.032284 6.242202
C 4.84694 4.350631 3.941136
C 4.603025 5.518738 4.882532
O 5.746254 5.812705 5.6871
%ENDBLOCK POSITIONS_ABS

%BLOCK KPOINTS_LIST
0.25 0.25 0.25 1.0
%ENDBLOCK KPOINTS_LIST
- ethanol.param
OBJECTIVES:
- Examine the convergence of the chemical shieldings with planewave cutoff
- Compare to experiment.
INSTRUCTIONS:
-
Look at the cell and param file. Note that the only special keyword is
task = magres -
Run castep.
castepsub -n 4 ethanolLook at the output file. At the end the isotropic chemical shielding, anisotropy, and asymmetry are reported (here we are only interested in the isotropic value.) -
This information, plus the full tensors is also given in the file ethanol.magres
-
You might wish to transfer the *.magres file back to your desktop to visualise with MagresView.
-
Examine the effect of increasing the cutoff energy (say 20-50 Ryd in steps of 10 Ryd). It always helps to plot a graph of the convergence (e.g. with gnuplot or xmgrace on the cluster - or with excel on the pc)
-
Find the "converged" hydrogen (or proton in NMR language) shieldings. We will compare them to experiment. The three methyl (CH3) protons undergo fast exchange; they "rotate" faster than the nuclear magnetic moment processes. The magnetic moment will therefore "see" an average chemical shielding. The same is true of the CH2 protons.
-
Average the CH3 and CH2 chemical shieldings. This will give you 3 unique chemical shieldings.
-
We now need to convert the chemical shieldings σiso to chemical shifts δiso on the experimental scale. We use the relation: δiso=σref-σ
A suitable σref for 1H is 30.97ppm.
 {width ="300"}
- Fig. 2 shows a modern high-resolution 1H spectrum for liquid ethanol. Note that the peaks are split due to J-coupling - the interaction of the 1H magnetic moments - but let's ignore that for now. The three peaks are roughly at 1.2ppm, 3.7ppm and 5ppm. You should find that your computed values agree for two sites. Do you know why the other site has such a large disagreement with experiment?